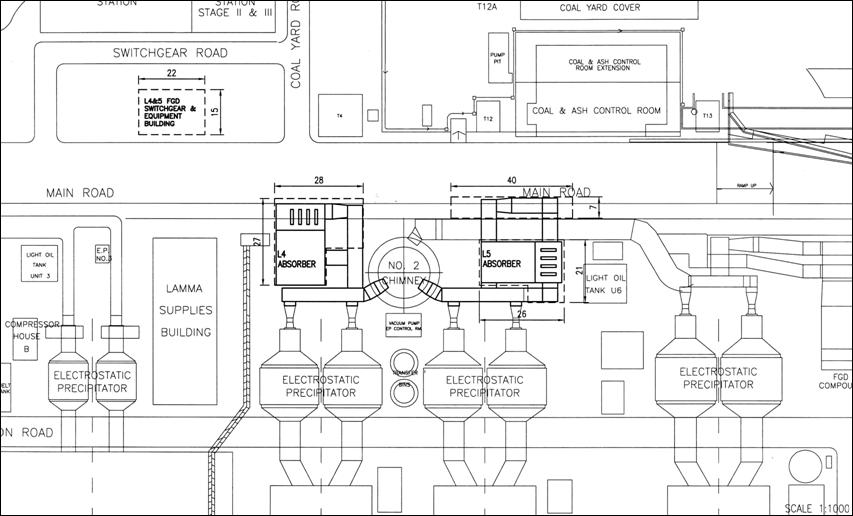
Figure 1.1a Location of New Facilities for L4 & L5 FGD Plants
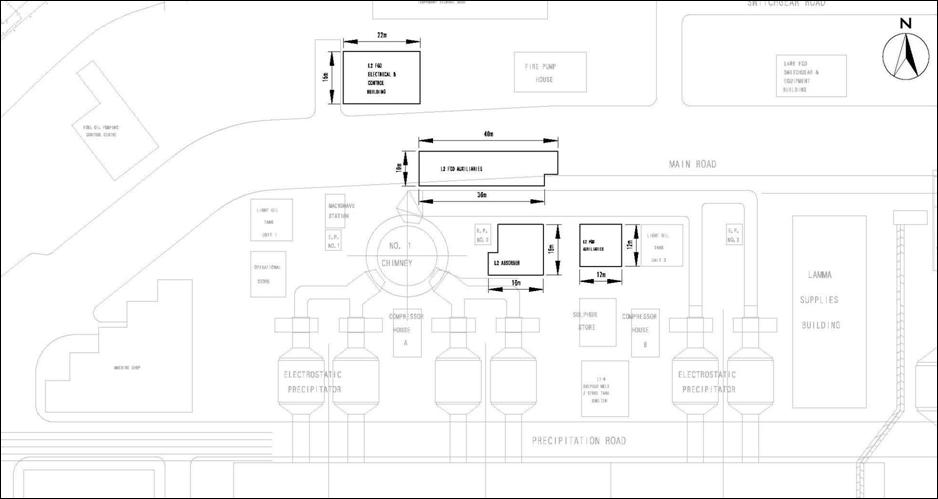
Figure 1.1b Location of New Facilities for L2 FGD Plant
Table of Content
1.3 Plant Availability during the Reporting Period
1.4 Malfunction/Outage Records of Pollution Control Equipment
1.5 Summary of EM&A Requirements
2.2 Summary of Results and Observations
3.2 Summary of Results and Observations
4.1 Review of Environmental Monitoring Procedures
4.2 Assessment of Environmental Monitoring Results
4.3 Status of Environmental Licensing and Permitting
4.4 Implementation Status of Environmental Mitigation Measures
4.5 Implementation Status of Event/Action Plan
4.6 Implementation Status of Environmental Complaint Handling Procedures
5.1 Outage Plan for the coming 3 months
5.2 Key issues for the coming 3 months
List of Tables
Table 2.1 Air Quality Monitoring Parameters and Frequency
Table 3.1 Water Quality Monitoring Parameters and Frequencies
Table 4.1 Summary of Action/Limit Level Exceedances on Monitoring Parameters
Table 4.2 Amount of Gypsum and Sludge Collected for Reuse by Contractor
Table 4.3 Summary of Environmental Licensing and Permit Status
Table 4.4 Environmental Complaints / Enquiries Received
Table 4.4 Outstanding Environmental Complaints / Enquiries Carried Over
List of figures
Figure 1.1a Location of New Facilities for L4 & L5 FGD Plant
Figure 1.1b Location of New Facilities for L2 FGD Plant
Figure 1.2a General Arrangement of L4 & L5 FGD Plant
Figure 1.2b General Arrangement of L2 FGD Plant
Figure 1.3 Schematic Diagram of L4 & L5 FGD Plant
Figure 1.4 Simplified Schematic Diagram of FGD Wastewater Treatment Plant
Figure 1.5 Organization Chart at Operational Phase
AppendiX
Appendix A Event/Action Plans in Response to Exceedance of AL Levels
Appendix B Air Quality Monitoring Results
Appendix C Summary Results on Water Quality Monitoring
Unit L5 Flue Gas Desulphurization (FGD) Plant commenced operation in July 2009, followed by Units L2 and L4 FGD Plants in April 2010 after completion of erection works and a series of commissioning tests. This is the quarterly Environmental Monitoring and Audit (EM&A) report for the Projects “Lamma Power Station Units L4 & L5 Flue Gas Desulphurization Plant Retrofit” and “Lamma Power Station Unit L2 Flue Gas Desulphurization Plant Retrofit” prepared by the Environmental Team (ET). This report presents the results of impact monitoring on air and water quality and environmental audit for the operation of the said projects in the period from July to September 2010.
Environmental monitoring for air quality and water quality were carried out for the purpose of this EM&A program as well as for fulfilling the requirements stipulated in the relevant licences. The results were checked against the established Action/Limit (AL) levels. The implementation status of the environmental mitigation measures, Event/Action Plan and environmental complaint handling procedures were also checked.
Plant Availability
Units L2, L4 and L5 were out of service during the following period:
|
Unit |
Period |
Remark |
|
L4 |
26/7/2010 10:12 to 19:14 |
Unit was tripped due to faulty FGD Outlet damper limits switch |
|
L4 |
27/08/2010 19:58 to 30/08/2010 05:58 |
Turbine TVEH converter check |
|
L4 |
16/09/2010 01:03 to 18/09/2010 07:37 |
Boiler RH tube leakage |
|
L5 |
20/08/2010 20:08 to 21/08/2010 05:37 |
30% Boiler MCR light oil firing test |
Malfunction/Outage Records of Pollution Control Equipment
Major outages of the Pollution Control Equipment during the reporting period are listed below:
|
Equipment |
Period |
Cause |
Actions Taken |
|
L2 FGD |
24/07/2010 00:03 to 14/08/2010 21:28 |
Defect rectification |
EPD was informed by letters on 22/07/2010 & 16/08/2010 |
|
L2 FGD |
13/09/2010 09:46 to 18/10/2010 15:41 |
Booster fan vibration high |
EPD was informed by letters on 15/09/2010 & 19/10/2010 |
|
L4 FGD |
25/08/2010 00:03 to 15/09/2010 01:19 |
Defect rectification and lining inspection |
EPD was informed by letters on 25/08/2010, 03/09/2010 & 15/09/2010 |
|
L5 FGD |
15/08/2010 01:36 to 24/08/2010 19:58 |
Plant computer system upgrading work |
EPD was informed by letters on 14/08/2010 & 25/08/2010 |
|
L5 FGD |
30/08/2010 01:36 to 19:00 |
Booster fan blade angle control fault |
EPD was informed by letter on 31/08/2010 |
For other minor outages, please refer to section 1.4 of the report.
Environmental Monitoring Works
Environmental monitoring works were performed during the operation of Units L2, L4 and L5 FGD Plants in the reporting period.
Air Quality
No exceedance of Action and Limit levels for air quality were recorded in the reporting period.
Water Quality
No exceedance of Action and Limit levels for water quality were recorded in the reporting period.
Environmental Licensing and Permitting
|
Description |
Permit / Licence No. |
Valid Period |
Issued To |
Date of Issuance |
|
|
From |
To |
||||
|
Environmental Permit for L4/5 FGD plants retrofit project |
EP-248/2006 |
25/04/2006 |
- |
HK Electric |
25/04/2006 |
|
Environmental Permit for Unit L2 FGD plant retrofit project |
EP-287/2007 |
02/10/2007 |
- |
HK Electric |
02/10/2007 |
|
Specified Processes Licence issued under APCO |
L-7-002(7) |
01/01/2009 |
31/12/2010
|
HK Electric |
31/12/2008 |
|
WPCO discharge licence for Ash Lagoon |
EP890/W2/XD018 |
16/04/2007 |
31/12/2011 |
HK Electric |
16/04/2007 |
Implementation Status of Environmental Mitigation Measures
Environmental mitigation measures were implemented in the reporting period.
Environmental Complaints
During the reporting period, there was one (1) enquiry concerning “dark smoke and combustion smell from Lamma P/S”. Yet no abnormality that might have caused the alleged observation was identified. There was no further enquiry since then. The case has already been mentioned in the last quarterly report.
Future key issues
Key issues to be considered in the coming months include:
Air Impact
· To continuously carry out the air quality monitoring for Units L2, L4 and L5.
Water Impact
· To continuously carry out the water quality monitoring for FGD WWT plant.
Concluding Remarks
The environmental performance of the projects was generally satisfactory.
Unit L5 Flue Gas Desulphurization (FGD) Plant commenced operation in July 2009, followed by Units L2 and L4 FGD Plants in April 2010 after completion of erection works and a series of commissioning tests. The Environmental Team (hereinafter called the “ET”) was formed within The Hongkong Electric Co. Ltd (HK Electric) to undertake Environmental Monitoring and Audit for the “Operation of Lamma Power Station Units L4 & L5 Flue Gas Desulpurization Plant Retrofit Project” under the requirements of Clause 2.18 of Environmental Permit (EP) No. EP-248/2006 and “Operation of Lamma Power Station Unit L2 Flue Gas Desulpurization Plant Retrofit Project” under the requirements of Clause 2.10 of Environmental Permit (EP) No. EP-287/2007.
This report summarizes the environmental monitoring and audit work for the said Projects for the period from July to September 2010.
The Projects involves retrofitting the three existing coal-fired generating Units L2, L4 and L5 of Lamma Power Station with Flue Gas Desulphurisation (FGD) plants for reducing sulphur dioxide emissions in support of Government policy to improve the air quality of the Pearl River Delta.
The Projects include the installation and operation of FGD plants with flue gas desulphurization efficiency of 90% for the three coal-fired Units L2, L4 & L5 to reduce the overall SO2 emissions from Lamma Power Station. The process adopted for the FGD plants is “Wet Limestone-Gypsum”, a technology which has already been used in, and proved effective and reliable for the existing coal-fired units L6, L7 & L8. The flue gas from the boiler is directed to the FGD absorber inside which removal of SO2 is take place by reaction with limestone slurry. After passing through the absorber, the treated flue gas is heated up by a gas-gas heater to over 80ºC at boiler rated capacity and directed back to the existing chimney for discharge to the atmosphere. Figure 1.1a, Figure 1.1b, Figure 1.2a, Figure 1.2b and Figure 1.3 show the location and schematic of the FGD plants.
Wastewater filtrated from the reacted limestone slurry, i.e. gypsum slurry, is produced and it is directed to the existing FGD wastewater treatment plant (WWTP). The FGD WWTP is designed to treat the effluent from FGD plants by alkalization, precipitation and neutralization processes. The schematic diagram of the FGD WWTP is illustrated in Figure 1.4.
The additional equipment for the FGD Plants retrofit projects for Units L2, L4 and L5 includes:
· Three sets of FGD absorbers and associated ductworks
· Three sets of booster fans
· Three sets of gas-gas heaters
· Two FGD Switchgear and Equipment Buildings
· Gypsum dewatering system comprising two sets of hydrocyclones and belt filters
The management structure to oversee the Projects includes the following:
· Environmental Protection Department (The Authority);
· General Manager (Corporate Development) (The official contact person between HK Electric and EPD);
· Environmental Team Leader (ET Leader);
· Environmental Team (ET).
The organization chart for the Operation EM&A programme is shown in Figure 1.5.
1.3 Plant Availability during the Reporting Period
Units L2, L4 and L5 were out of service during the following period:
|
Unit |
Period |
Remark |
|
L4 |
26/7/2010 10:12 to 19:14 |
Unit was tripped due to faulty FGD Outlet damper limits switch |
|
L4 |
27/08/2010 19:58 to 30/08/2010 05:58 |
Turbine TVEH converter check |
|
L4 |
16/09/2010 01:03 to 18/09/2010 07:37 |
Boiler RH tube leakage |
|
L5 |
20/08/2010 20:08 to 21/08/2010 05:37 |
30% Boiler MCR light oil firing test |
1.4 Malfunction/Outage Records of Pollution Control Equipment
|
Equipment |
Period |
Cause |
Actions Taken |
|
L2 FGD |
02/07/2010 21:40 to 21:47 |
FGD was bypassed due to booster fan inlet damper control sluggish |
EPD was informed by letter on 05/07/2010 |
|
L2 FGD |
10/07/2010 04:12 to 04:14 |
Routine checking of bypass dampers |
EPD was informed by letter on 13/07/2010 |
|
L2 FGD |
17/07/2010 23:42 to 18/07/2010 00:02 |
Routine checking of bypass dampers |
EPD was informed by letter on 19/07/2010 |
|
L2 FGD |
21/07/2010 13:11 to 13:14 17:29 to 17:37 |
FGD was bypassed due to booster fan inlet damper control sluggish |
EPD was informed by letter on 22/07/2010 |
|
L2 FGD |
24/07/2010 00:03 to 14/08/2010 21:28 |
Defect rectification |
EPD was informed by letters on 22/07/2010 & 16/08/2010 |
|
L2 FGD |
20/08/2010 06:18 to 06:23 |
FGD was bypassed due to booster fan inlet damper control sluggish |
EPD was informed by letter on 24/08/2010 |
|
L2 FGD |
23/08/2010 05:41 to 05:59 |
FGD was bypassed due to booster fan inlet damper control sluggish |
EPD was informed by letter on 24/08/2010 |
|
L2 FGD |
24/08/2010 09:47 to 10:23 |
FGD was bypassed due to booster fan inlet damper control sluggish |
EPD was informed by letter on 24/08/2010 |
|
L2 FGD |
25/08/2010 00:17 to 00:26 19:07 to 19:17 |
FGD was bypassed due to booster fan inlet damper control sluggish |
EPD was informed by letter on 27/08/2010 |
|
L2 FGD |
05/09/2010 04:29 to 04:36 |
Routine checking of bypass dampers |
EPD was informed by letter on 07/09/2010 |
|
L2 FGD |
09/09/2010 18:40 to 18:45
|
FGD was bypassed due to booster fan inlet damper control sluggish |
EPD was informed by letter on 13/09/2010 |
|
L2 FGD |
12/09/2010 13:14 to 13:17
|
FGD was bypassed due to booster fan inlet damper control sluggish |
EPD was informed by letter on 13/09/2010 |
|
L2 FGD |
13/09/2010 09:46 to 18/10/2010 15:41 |
Booster fan vibration high |
EPD was informed by letters on 15/09/2010 & 19/10/2010 |
|
L2 FGD |
09/09/2010 18:40 to 18:45
|
FGD was bypassed due to booster fan inlet damper control sluggish |
EPD was informed by letter on 13/09/2010 |
|
L2 FGD |
12/09/2010 13:14 to 13:17
|
FGD was bypassed due to booster fan inlet damper control sluggish |
EPD was informed by letter dated 13/09/2010 |
|
L4 FGD |
03/07/2010 02:15 to 02:18
|
Routine checking of bypass dampers |
EPD was informed by letter dated 05/07/2010 |
|
L4 FGD |
10/07/2010 04:08 to 04:13
|
Routine checking of bypass dampers |
EPD was informed by letter dated 13/07/2010 |
|
L4 FGD |
17/07/2010 03:12 to 03:18
|
Routine checking of bypass dampers |
EPD was informed by letter dated 19/07/2010 |
|
L4 FGD |
24/07/2010 01:46 to 02:18
|
Routine checking of bypass dampers |
EPD was informed by letter dated 26/07/2010 |
|
L4 FGD |
07/08/2010 02:28 to 02:33
|
Routine checking of bypass dampers |
EPD was informed by letter dated 09/08/2010 |
|
L4 FGD |
14/08/2010 03:08 to 03:13
|
Routine checking of bypass dampers |
EPD was informed by letter dated 14/08/2010 |
|
L4 FGD |
21/08/2010 03:26 to 03:43
|
Routine checking of bypass dampers |
EPD was informed by letter dated 24/08/2010 |
|
L4 FGD |
25/08/2010 00:03 to 15/09/2010 01:19 |
Defect rectification and lining inspection |
EPD was informed by letters on 25/08/2010, 03/09/2010 & 15/09/2010 |
|
L4 FGD |
26/09/2010 15:20 to 15:33 |
Tripping of absorber recirculating pump |
EPD was informed by letter on 27/09/2010 |
|
L5 FGD |
02/07/2010 16:00 to 16:37 |
FGD was bypassed due to Mal-operation of booster fan vibration high alarm |
EPD was informed by letter on 05/07/2010 |
|
L5 FGD |
10/07/2010 03:38 to 03:42 |
Routine checking of bypass dampers |
EPD was informed by letter on 13/07/2010 |
|
L5 FGD |
10/07/2010 05:23 to 06:02 |
FGD was bypassed due to booster fan control oil temperature high |
EPD was informed by letter on 13/07/2010 |
|
L5 FGD |
17/07/2010 03:22 to 03:29 |
Routine checking of bypass dampers |
EPD was informed by letter on 19/07/2010 |
|
L5 FGD |
24/07/2010 02:28 to 02:50 |
Routine checking of bypass dampers |
EPD was informed by letter on 26/07/2010 |
|
L5 FGD |
26/07/2010 19:29 to 21:27 |
Repair work of FGD inlet and outlet damper limits |
EPD was informed by letter on 27/07/2010 |
|
L5 FGD |
31/07/2010 01:25 to 01:27 |
Routine checking of bypass dampers |
EPD was informed by letter on 02/08/2010 |
|
L5 FGD |
07/08/2010 02:21 to 02:26 |
Routine checking of bypass dampers |
EPD was informed by letter on 09/08/2010 |
|
L5 FGD |
15/08/2010 01:36 to 24/08/2010 19:58 |
Plant computer system upgrading work |
EPD was informed by letters on 14/08/2010 & 25/08/2010 |
|
L5 FGD |
30/08/2010 01:36 to 19:00 |
Booster fan blade angle control fault |
EPD was informed by letter on 31/08/2010 |
|
L5 FGD |
02/09/2010 15:54 to 15:57 |
FGD was bypassed due to inlet temperature high |
EPD was informed by letter on 03/09/2010 |
|
L5 FGD |
04/09/2010 02:07 to 02:12 |
Routine checking of bypass dampers |
EPD was informed by letter on 07/09/2010 |
|
L5 FGD |
11/09/2010 04:27 to 04:33 |
Routine checking of bypass dampers |
EPD was informed by letter on 13/09/2010 |
|
L5 FGD |
18/09/2010 02:44 to 03:03 |
Routine checking of bypass dampers |
EPD was informed by letter on 20/09/2010 |
|
L5 FGD |
25/09/2010 01:11 to 01:14 |
Routine checking of bypass dampers |
EPD was informed by letter on 27/09/2010 |
1.5 Summary of EM&A Requirements
Environmental Monitoring and Audit (EM&A) requirements have been discussed in the Environmental Impact Assessment (EIA) Report/ Project Profile for the Projects. The assessment results indicate that environmental monitoring works required for the EM&A programmes of these Projects are already in place or would be implemented under Lamma Power Station Extension Environmental Permit or environmental licenses for the operation of the existing Lamma Power Station. Such monitoring works are considered adequate for the Projects and no additional EM&A activities are required. Hence, environmental monitoring for air quality and water quality are carried out for the purpose of this EM&A program as well as for fulfilling the requirements stipulated in the relevant licences.
The EM&A monitoring work for air and water quality are described in Section 2 and Section 3 respectively.
The following environmental audits are summarized in Section 4 of the report:
· Environmental monitoring results;
· The status of environmental licensing and permits for the Projects;
· The implementation status of environmental protection and pollution control / mitigation measures.
The future key issues for the Projects will be reported in Section 5 of this report.
Figure 1.1a Location of New Facilities for L4 & L5 FGD Plants
Figure 1.1b Location of New Facilities for L2 FGD Plant
Figure 1.2a General Arrangement of L4 & L5 FGD Plants
Figure 1.2b General Arrangement of L2 FGD Plant
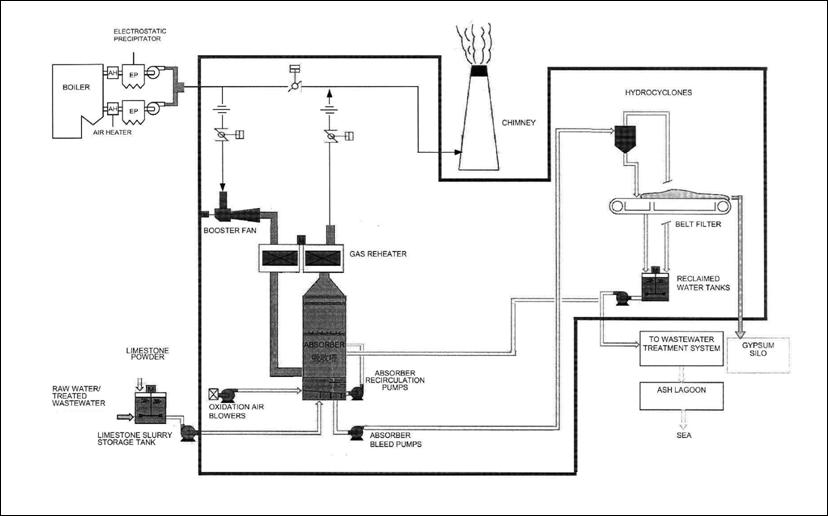
Figure 1.3 Schematic Diagram of the L4 & L5 FGD Plant
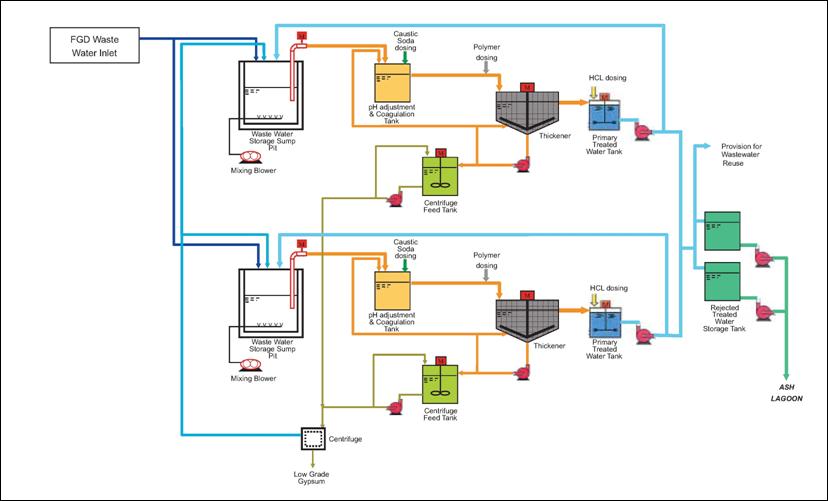
Figure 1.4 Simplified Schematic Diagram of FGD Wastewater Treatment Plant
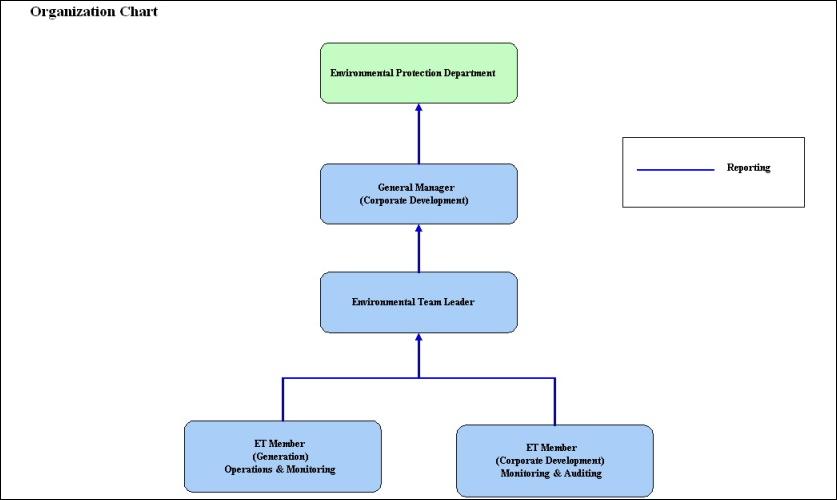
Figure 1.5 Organization Structure at Operational Phase of the Projects
Since the Projects will bring a general air quality improvement, no additional EM&A activities are considered required, besides those already in place, such as those required by specified process licenses for the operation of the existing Lamma Power Station. In accordance with the requirements stipulated in the Specified Processes Licence issued under Air Pollution Control Ordinance, various operation parameters as stated in Table 2.1 were monitored and checked against the Action/Limit Levels shown in Appendix A.
Table 2.1 Air Quality Monitoring Parameters and Frequency
|
Sources of Emission |
Parameter |
Frequency |
|
Steam boilers L2, L4 & L5 |
Particulate |
Once / year |
|
Particulate (Opacity) |
Continuous |
|
|
SO2 |
Continuous |
|
|
NOx expressed as NO2 (For L4 and L5 only) |
Continuous |
|
|
Fugitive Dust (Coal, PFA, Limestone, gypsum) |
Total Suspended Particulate |
Once every six days |
|
Chimney emissions |
Ambient air |
Continuous at existing ambient air monitoring stations |
|
|
SO2 |
|
|
|
NO2 |
2.2 Summary of Results and Observations
Monitoring of various parameters as listed in Table 2.1 above was conducted during the operation of Units L2, L4 and L5 in the reporting period. A summary of monitoring data is shown in Appendix B.
No Action/Limit Level exceedance was recorded in the reporting period.
According to the EIA Report/ Project Profile for the Projects, the current monitoring programme for the Lamma Power Station can cover the Projects and no additional EM&A measures are required besides those already in place. Hence, the EM&A work on water quality should strictly follow the relevant monitoring requirements stipulated in the discharge licence for Ash Lagoon issued under the Water Pollution Control Ordinance (WPCO).
Water quality monitoring was carried out for FGD Waste Water Treatment Plant (WWTP) in the reporting period. The parameters stated in Table 3.1 were monitored and checked against the Action/Limit Levels as given in Appendix A.
Table 3.1 Water Quality Monitoring Parameters and Frequencies
|
Item |
Parameters |
Frequencies |
|
1 |
pH |
Daily |
|
2 |
Suspended Solids |
Daily |
|
3 |
Iron |
Monthly |
|
4 |
Barium |
Monthly |
|
5 |
Mercury |
Monthly |
|
6 |
Cadmium |
Monthly |
|
7 |
Cyanide |
Monthly |
|
8 |
Total Phosphorus |
Monthly |
|
9 |
Total Nitrogen |
Monthly |
3.2 Summary of Results and Observations
Monitoring of various parameters as listed in Table 3.1 above was carried out during the discharge of the WWTP in the reporting period. A summary of the data is shown in Appendix C.
The data recorded for the monitoring parameters were all below their corresponding Action/Limit Levels. No Action/Limit level exceedance was recorded in the reporting period. The effluent quality was generally satisfactory.
4.1 Review of Environmental Monitoring Procedures
The environmental monitoring procedures were regularly reviewed by the Environmental Team. No modification to the existing monitoring procedures was recommended.
4.2 Assessment of Environmental Monitoring Results
Monitoring results for Air Quality and Water Quality
The environmental monitoring results for air quality, noise and water quality are presented in Sections 2, 3 and 4 respectively are summarized in Table 4.1.
Table 4.1 Summary of Action/Limit Level Exceedances on Monitoring Parameters
|
Item |
Parameter Monitored |
Monitoring Period |
No. of Exceedances In |
Event/Action Plan Implementation Status and Results |
|
|
Action Level |
Limit Level |
||||
|
Air |
|||||
|
1 |
Annual analysis of dust particulate emission rates at chimney stacks. |
01/07/10-30/09/10
|
N.A. |
0 |
|
|
2 |
Continuous monitoring of opacity, NOx, SO2 and CO2 in the flue gas at the chimney stacks |
01/07/10-30/09/10
|
0 |
0 |
|
|
3 |
TSP monitoring at Lamma Power Station Boundary (ie East Gate and Reservoir). |
01/07/10-30/09/10
|
0 |
0 |
|
|
4 |
Ambient SO2 & NOx monitoring at the Peak, Queen Mary Hospital , Victoria Road, Chung Hom Kok, Ap Lei Chau and Cheung Chau. |
01/07/10-30/09/10
|
0 |
0 |
|
|
Water |
|||||
|
1 |
pH in WWTP Effluent |
01/07/10-30/09/10
|
0 |
0 |
|
|
2 |
Suspended Solids in WWTP Effluent |
01/07/10-30/09/10
|
0 |
0 |
|
|
3 |
Iron in WWTP Effluent |
01/07/10-30/09/10
|
0 |
0 |
|
|
4 |
Barium in WWTP Effluent |
01/07/10-30/09/10
|
0 |
0 |
|
|
5 |
Mercury in WWTP Effluent |
01/07/10-30/09/10
|
0 |
0 |
|
|
6 |
Cadmium in WWTP Effluent |
01/07/10-30/09/10
|
0 |
0 |
|
|
7 |
Cyanide in WWTP Effluent |
01/07/10-30/09/10
|
0 |
0 |
|
|
8 |
Total Phosphorus in WWTP Effluent |
01/07/10-30/09/10
|
0 |
0 |
|
|
9 |
Total Nitrogen in WWTP Effluent |
01/07/10-30/09/10
|
0 |
0 |
|
Waste Management Records
The quantity of FGD gypsum and sludge collected for reuse by contractor in the reporting period are shown in Table 4.2.
Table 4.2 Amount of Gypsum and Sludge Collected for Reuse by Contractor
|
Period |
Amount of Gypsum Collected |
Amount of Sludge Collected |
|
July 2010 |
9,705.9 MT |
25.0 MT |
|
August 2010 |
11,449.4 MT |
50.0 MT |
|
September 2010 |
10,244.1 MT |
45.9 MT |
4.3 Status of Environmental Licensing and Permitting
All permits/licenses obtained as of June 2010 are summarised in Table 4.3.
Table 4.3 Summary of Environmental Licensing and Permit Status
|
Description |
Permit / Licence No. |
Valid Period |
Status |
|
|
From |
To |
|||
|
Environmental Permit for Units L4/5 FGD Plants Retrofit |
EP-248/2006 |
25/04/2006 |
- |
Valid |
|
Environmental Permit for Unit L2 FGD Plant Retrofit |
EP-287/2007 |
02/10/2007 |
- |
Valid |
|
Specified Processes Licence issued under APCO |
L-7-002(7) |
01/01/2009 |
31/12/2010
|
Valid |
|
WPCO discharge licence for Ash Lagoon |
EP890/W2/XD018 |
16/04/2007 |
31/12/2011 |
Valid |
4.4 Implementation Status of Environmental Mitigation Measures
Mitigation measures detailed in the EIA Report and EP are required to be implemented. An updated summary of the Environmental Mitigation Implementation Schedule (EMIS) is presented in Appendix D.
4.5 Implementation Status of Event/Action Plan
A list of specific actions in the event of exceedances of the various threshold levels for specific emission and discharge sources is given in Appendix A.
As no Action/Limit level exceedance was recorded, no action has been devised.
4.6 Implementation Status of Environmental Complaint Handling Procedures
During the reporting period, there was one (1) enquiry concerning “dark smoke and combustion smell from Lamma P/S” as summarized in Table 4.4. The case has already been mentioned in the last quarterly report.
Table 4.4 Environmental Complaints / Enquiries Received
|
Case Reference / Date, Time Received / Date, Time Concerned |
Descriptions / Actions Taken |
Conclusion / Status |
|
Reference: EC100700165
Received: 08/07/2010 p.m.
Concerned: 23/06/2010 – 07/07/2010 at night and mid-night |
EPD informed HK Electric via email that the Department had received two complaints against “dark smoke and combustion smell from the chimneys of Lamma P/S at night and mid-night”. After investigation, HK Electric found no abnormality that might have caused the alleged observation. HK Electric has also provided relevant monitoring data to EPD for reference as requested. There was no further enquiry since then. |
Nothing abnormal was identified. EPD was replied and there was no further enquiry. |
Table 4.4 Outstanding Environmental Complaints / Enquiries Carried Over
|
Case Reference / Date, Time Received / Date, Time Concerned |
Descriptions / Actions Taken |
Conclusion / Status |
|
Nil |
N/A |
N/A |
5.1 Outage Plan for the coming 3 months
No major outage planned for the next 3 months.
5.2 Key issues for the coming 3 months
Key issues to be considered in the coming 3 months include:
Air Impact
· To continuously carry out the air quality monitoring for Units L2, L4 and L5.
Water Impact
· To continuously carry out the water quality monitoring for FGD Waste Water Treatment Plant.
Environmental monitoring was performed as required in the reporting period from July to September 2010. All monitoring results were checked and reviewed.
No Action/Limit level exceedance on air quality parameters were recorded in the reporting period.
No Action/Limit level exceedance on water quality parameters were recorded in the reporting period.
Environmental mitigation measures recommended in the EIA Report and EP were implemented in the reporting period. There was one (1) enquiry concerning “dark smoke and combustion smell from Lamma P/S”. Yet no abnormality that might have caused the alleged observation was identified. The case has already been mentioned in the last quarterly report. No prosecution was received for the Projects in the reporting period.
The environmental performance of the Projects was generally satisfactory.
Appendix A Event/Action Plans in Response to Exceedance of AL Levels
A.1 Air
|
Source of Emissions |
Parameters to be Monitored |
Frequency |
Concentration Not to Be Exceeded |
Action |
Limit |
Proposed Action |
|
Steam boilers L2, L4 and L5
|
Particulate Particulate (Opacity) SO2 NOx expressed as NO2 (For L4 and L5 only) |
once/year continuous continuous continuous |
85 mg/Nm3 40% (bihourly) 200 mg/Nm3 (1h) 615 mg/Nm3 (1h) |
- 35 190 585 |
85 40 200 615 |
ET Leader informs Generation Division at action level. Maintenance initiated. Temporary load shift until pollution control equipment repaired and reinstated. Report to EPD. |
|
Fugitive dust (Coal, PFA, limestone, gypsum) |
TSP |
Once every six days. |
260 (µg/m3) (24 hours) |
- |
260 |
Investigation of sources and additional dust suppression to be employed at Limit level. Frequency of monitoring to be increased as necessary. |
|
Chimney emissions |
Ambient air SO2
NO2 |
Continuous at existing ambient air monitoring stations |
800 (µg/m3) (1h) 300 (µg/m3) (1h) |
- - |
800 300 |
ET to review data on post-hoc basis and check for possible power station contribution. |
|
Source of Discharges |
Parameters to be Monitored |
Frequency |
Concentration Not to Be Exceeded |
Action |
Limit |
Proposed Action |
|
FGD Wastewater Treatment Plant |
pH |
Daily |
6-9 |
- |
6-9 |
If pH exceeds limit level, consideration to be given to adjust chemical dosing. ET Leader inform Generation Division and investigation be initiated to identify and remedy cause.
For all other parameters except pH, Generation Division to be informed, frequency of monitoring to be increased, and investigations to be initiated to identify cause and remedy if concentration exceeds action level. If problem persists to exceed the limit level, ET Leader verbally informs EPD and ensures remedial actions implemented. |
|
Suspended Solids |
Daily |
30 mg/L |
25 |
30 |
||
|
Iron |
Monthly |
4 mg/L |
3.6 |
4 |
||
|
Barium |
Monthly |
1.5 mg/L |
1.3 |
1.5 |
||
|
Mercury |
Monthly |
0.005 mg/L |
0.0045 |
0.005 |
||
|
Cadmium |
Monthly |
0.005 mg/L |
0.0045 |
0.005 |
||
|
Cyanide |
Monthly |
0.1 mg/L |
0.09 |
0.1 |
||
|
Total Phosphorus |
Monthly |
8 mg/L |
7.2 |
8 |
||
|
Total Nitrogen |
Monthly |
400 mg/L |
360 |
400 |
Air Quality Monitoring Results
B.1 Ambient Total Suspended Particulate Monitoring at Lamma Power Station
Date: Second Quarter of 2010 (July - September)
|
DATE |
TSP CONCENTRATION (µg/m3) |
WEATHER INFORMATION (from Hong Kong Observatory) |
|||
|
Reservoir |
East Gate |
Mean Wind Speed (km/hr) |
Prevailing Wind Dir. ( º ) |
Mean R.H.
(%) |
|
|
04/07/2010 |
29 |
43 |
30.3 |
230 |
79 |
|
10/07/2010 |
61 |
26 |
18.4 |
210 |
76 |
|
16/07/2010 |
44 |
102 |
23.9 |
120 |
88 |
|
22/07/2010 |
32 |
78 |
35.6 |
120 |
93 |
|
28/07/2010 |
34 |
39 |
23.5 |
210 |
93 |
|
03/08/2010 |
44 |
38 |
17.9 |
230 |
76 |
|
09/08/2010 |
35 |
33 |
17.3 |
090 |
82 |
|
15/08/2010 |
27 |
24 |
13.7 |
210 |
83 |
|
21/08/2010 |
53 |
48 |
18.6 |
060 |
78 |
|
27/08/2010 |
34 |
22 |
5.3 |
340 |
78 |
|
02/09/2010 |
100 |
86 |
14.5 |
290 |
70 |
|
08/09/2010 |
44 |
42 |
16.5 |
250 |
80 |
|
14/09/2010 |
23 |
20 |
17.8 |
040 |
86 |
|
20/09/2010 |
122 |
147 |
35.2 |
260 |
82 |
|
26/09/2010 |
34 |
32 |
20.7 |
060 |
82 |
TSP (µg/m3)
Action Level -
Limit Level 260
Equipment used: Reservoir & East Gate : High Volume Air Sampler
B.2 Unit L2, L4 and L5 Stack Monitoring at Lamma Power Station
B.2.1 Monthly Summary of Stack NOx and SO2 for Unit L5
|
Date |
Daily Maximum |
||
|
SO2 concentration (mg/Nm3) # |
NOx concentration (mg/Nm3) # |
Opacity (%) |
|
|
1/7/2010 |
16 |
373 |
14 |
|
2/7/2010 |
109 |
378 |
15 |
|
3/7/2010 |
59 |
291 |
15 |
|
4/7/2010 |
23 |
303 |
14 |
|
5/7/2010 |
58 |
354 |
15 |
|
6/7/2010 |
74 |
347 |
15 |
|
7/7/2010 |
46 |
361 |
15 |
|
8/7/2010 |
23 |
332 |
15 |
|
9/7/2010 |
42 |
309 |
16 |
|
10/7/2010 |
41 |
310 |
17 |
|
11/7/2010 |
35 |
417 |
17 |
|
12/7/2010 |
36 |
418 |
18 |
|
13/7/2010 |
38 |
377 |
17 |
|
14/7/2010 |
43 |
341 |
16 |
|
15/7/2010 |
55 |
342 |
17 |
|
16/7/2010 |
52 |
309 |
15 |
|
17/7/2010 |
26 |
319 |
15 |
|
18/7/2010 |
20 |
317 |
14 |
|
19/7/2010 |
36 |
337 |
14 |
|
20/7/2010 |
39 |
306 |
14 |
|
21/7/2010 |
54 |
310 |
14 |
|
22/7/2010 |
63 |
312 |
14 |
|
23/7/2010 |
86 |
339 |
15 |
|
24/7/2010 |
80 |
310 |
17 |
|
25/7/2010 |
50 |
300 |
14 |
|
26/7/2010 |
48 |
336 |
15 |
|
27/7/2010 |
62 |
282 |
15 |
|
28/7/2010 |
42 |
272 |
15 |
|
29/7/2010 |
51 |
312 |
15 |
|
30/7/2010 |
37 |
327 |
15 |
|
31/7/2010 |
44 |
317 |
15 |
|
Date |
Daily Maximum |
||
|
SO2 concentration (mg/Nm3) # |
NOx concentration (mg/Nm3) # |
Opacity (%) |
|
|
1/8/2010 |
53 |
319 |
15 |
|
2/8/2010 |
66 |
391 |
18 |
|
3/8/2010 |
31 |
366 |
14 |
|
4/8/2010 |
50 |
356 |
15 |
|
5/8/2010 |
100 |
403 |
15 |
|
6/8/2010 |
72 |
357 |
15 |
|
7/8/2010 |
77 |
378 |
20 |
|
8/8/2010 |
58 |
358 |
15 |
|
9/8/2010 |
62 |
386 |
15 |
|
10/8/2010 |
61 |
380 |
15 |
|
11/8/2010 |
76 |
357 |
15 |
|
12/8/2010 |
60 |
442 |
18 |
|
13/8/2010 |
53 |
454 |
18 |
|
14/8/2010 |
39 |
477 |
20 |
|
15/8/2010 |
6 |
438 |
15 |
|
16/8/2010 |
FGD bypassed |
445 |
23 |
|
17/8/2010 |
FGD bypassed |
423 |
18 |
|
18/8/2010 |
FGD bypassed |
418 |
19 |
|
19/8/2010 |
FGD bypassed |
399 |
19 |
|
20/8/2010 |
FGD bypassed |
314 |
16 |
|
21/8/2010 |
FGD bypassed |
329 |
15 |
|
22/8/2010 |
FGD bypassed |
453 |
15 |
|
23/8/2010 |
FGD bypassed |
529 |
19 |
|
24/8/2010 |
42 |
424 |
17 |
|
25/8/2010 |
47 |
404 |
20 |
|
26/8/2010 |
47 |
415 |
19 |
|
27/8/2010 |
99 |
412 |
15 |
|
28/8/2010 |
88 |
366 |
15 |
|
29/8/2010 |
70 |
355 |
15 |
|
30/8/2010 |
92 |
303 |
17 |
|
31/8/2010 |
112 |
321 |
15 |
|
Date |
Daily Maximum |
||
|
SO2 concentration (mg/Nm3)# |
NOx concentration (mg/Nm3) # |
Opacity (%) |
|
|
1/9/2010 |
83 |
238 |
15 |
|
2/9/2010 |
78 |
267 |
14 |
|
3/9/2010 |
84 |
315 |
15 |
|
4/9/2010 |
80 |
344 |
15 |
|
5/9/2010 |
59 |
283 |
15 |
|
6/9/2010 |
97 |
298 |
15 |
|
7/9/2010 |
99 |
306 |
15 |
|
8/9/2010 |
92 |
322 |
16 |
|
9/9/2010 |
81 |
290 |
15 |
|
10/9/2010 |
72 |
420 |
21 |
|
11/9/2010 |
96 |
305 |
16 |
|
12/9/2010 |
115 |
304 |
15 |
|
13/9/2010 |
140 |
378 |
17 |
|
14/9/2010 |
96 |
320 |
15 |
|
15/9/2010 |
101 |
290 |
14 |
|
16/9/2010 |
78 |
308 |
15 |
|
17/9/2010 |
58 |
423 |
21 |
|
18/9/2010 |
29 |
358 |
22 |
|
19/9/2010 |
21 |
418 |
20 |
|
20/9/2010 |
53 |
450 |
22 |
|
21/9/2010 |
78 |
386 |
21 |
|
22/9/2010 |
103 |
389 |
18 |
|
23/9/2010 |
42 |
336 |
15 |
|
24/9/2010 |
41 |
303 |
19 |
|
25/9/2010 |
73 |
364 |
16 |
|
26/9/2010 |
55 |
317 |
14 |
|
27/9/2010 |
65 |
334 |
20 |
|
28/9/2010 |
84 |
266 |
21 |
|
29/9/2010 |
71 |
302 |
14 |
|
30/9/2010 |
93 |
253 |
14 |
Note: # - Hourly average value. Expressed as at 0ºC, 101.325kPa, dry and corrected to 12% CO2 condition.
* - Unit L5 was not on load.
B.2.2 Monthly Summary of Stack NOx and SO2 for Unit L4
|
Date |
Daily Maximum |
||
|
SO2 concentration (mg/Nm3) # |
NOx concentration (mg/Nm3) # |
Opacity (%) |
|
|
1/7/2010 |
29 |
374 |
7 |
|
2/7/2010 |
108 |
366 |
9 |
|
3/7/2010 |
106 |
416 |
12 |
|
4/7/2010 |
77 |
443 |
8 |
|
5/7/2010 |
91 |
439 |
8 |
|
6/7/2010 |
116 |
326 |
12 |
|
7/7/2010 |
93 |
436 |
9 |
|
8/7/2010 |
52 |
274 |
8 |
|
9/7/2010 |
78 |
342 |
8 |
|
10/7/2010 |
44 |
292 |
9 |
|
11/7/2010 |
86 |
346 |
10 |
|
12/7/2010 |
91 |
306 |
11 |
|
13/7/2010 |
78 |
325 |
15 |
|
14/7/2010 |
91 |
339 |
16 |
|
15/7/2010 |
103 |
374 |
16 |
|
16/7/2010 |
93 |
476 |
14 |
|
17/7/2010 |
111 |
358 |
14 |
|
18/7/2010 |
117 |
358 |
15 |
|
19/7/2010 |
134 |
382 |
16 |
|
20/7/2010 |
128 |
415 |
13 |
|
21/7/2010 |
129 |
388 |
13 |
|
22/7/2010 |
119 |
412 |
13 |
|
23/7/2010 |
126 |
441 |
14 |
|
24/7/2010 |
127 |
435 |
14 |
|
25/7/2010 |
131 |
364 |
14 |
|
26/7/2010 |
118 |
447 |
15 |
|
27/7/2010 |
117 |
394 |
14 |
|
28/7/2010 |
116 |
376 |
12 |
|
29/7/2010 |
93 |
303 |
17 |
|
30/7/2010 |
91 |
318 |
16 |
|
31/7/2010 |
154 |
364 |
15 |
|
Date |
Daily Maximum |
||
|
SO2 concentration (mg/Nm3) # |
NOx concentration (mg/Nm3) # |
Opacity (%) |
|
|
1/8/2010 |
116 |
330 |
15 |
|
2/8/2010 |
104 |
384 |
15 |
|
3/8/2010 |
93 |
473 |
14 |
|
4/8/2010 |
102 |
411 |
16 |
|
5/8/2010 |
87 |
412 |
16 |
|
6/8/2010 |
100 |
458 |
15 |
|
7/8/2010 |
115 |
308 |
16 |
|
8/8/2010 |
88 |
355 |
14 |
|
9/8/2010 |
108 |
416 |
15 |
|
10/8/2010 |
125 |
339 |
16 |
|
11/8/2010 |
120 |
370 |
12 |
|
12/8/2010 |
125 |
468 |
16 |
|
13/8/2010 |
98 |
317 |
13 |
|
14/8/2010 |
104 |
387 |
14 |
|
15/8/2010 |
82 |
368 |
14 |
|
16/8/2010 |
67 |
388 |
19 |
|
17/8/2010 |
66 |
389 |
22 |
|
18/8/2010 |
63 |
459 |
14 |
|
19/8/2010 |
70 |
346 |
18 |
|
20/8/2010 |
80 |
444 |
18 |
|
21/8/2010 |
53 |
342 |
15 |
|
22/8/2010 |
50 |
367 |
14 |
|
23/8/2010 |
102 |
492 |
18 |
|
24/8/2010 |
34 |
383 |
16 |
|
25/8/2010 |
FGD bypassed |
429 |
17 |
|
26/8/2010 |
FGD bypassed |
456 |
20 |
|
27/8/2010 |
FGD bypassed |
356 |
15 |
|
28/8/2010 |
* |
* |
* |
|
29/8/2010 |
* |
* |
* |
|
30/8/2010 |
FGD bypassed |
406 |
19 |
|
31/8/2010 |
FGD bypassed |
445 |
20 |
|
Date |
Daily Maximum |
||
|
SO2 concentration (mg/Nm3)# |
NOx concentration (mg/Nm3) # |
Opacity (%) |
|
|
1/9/2010 |
FGD bypassed |
393 |
19 |
|
2/9/2010 |
FGD bypassed |
386 |
20 |
|
3/9/2010 |
FGD bypassed |
425 |
20 |
|
4/9/2010 |
FGD bypassed |
427 |
20 |
|
5/9/2010 |
FGD bypassed |
399 |
14 |
|
6/9/2010 |
FGD bypassed |
413 |
24 |
|
7/9/2010 |
FGD bypassed |
401 |
14 |
|
8/9/2010 |
FGD bypassed |
457 |
17 |
|
9/9/2010 |
FGD bypassed |
467 |
14 |
|
10/9/2010 |
FGD bypassed |
461 |
20 |
|
11/9/2010 |
FGD bypassed |
388 |
24 |
|
12/9/2010 |
FGD bypassed |
443 |
19 |
|
13/9/2010 |
FGD bypassed |
470 |
19 |
|
14/9/2010 |
FGD bypassed |
375 |
11 |
|
15/9/2010 |
121 |
363 |
14 |
|
16/9/2010 |
* |
* |
* |
|
17/9/2010 |
* |
* |
* |
|
18/9/2010 |
64 |
450 |
14 |
|
19/9/2010 |
41 |
499 |
14 |
|
20/9/2010 |
101 |
443 |
18 |
|
21/9/2010 |
100 |
413 |
13 |
|
22/9/2010 |
98 |
410 |
18 |
|
23/9/2010 |
68 |
474 |
13 |
|
24/9/2010 |
84 |
344 |
19 |
|
25/9/2010 |
38 |
507 |
18 |
|
26/9/2010 |
28 |
319 |
12 |
|
27/9/2010 |
19 |
350 |
13 |
|
28/9/2010 |
6 |
353 |
13 |
|
29/9/2010 |
3 |
410 |
18 |
|
30/9/2010 |
2 |
468 |
11 |
Note: # - Hourly average value. Expressed as at 0ºC, 101.325kPa, dry and corrected to 12% CO2 condition.
* - Unit L4 was not on load.
B.2.3 Monthly Summary of Stack SO2 for Unit L2
|
Date |
Daily Maximum |
|
|
SO2 concentration (mg/Nm3) # |
Opacity (%) |
|
|
1/7/2010 |
62 |
13 |
|
2/7/2010 |
113 |
13 |
|
3/7/2010 |
70 |
13 |
|
4/7/2010 |
59 |
13 |
|
5/7/2010 |
90 |
14 |
|
6/7/2010 |
107 |
13 |
|
7/7/2010 |
112 |
14 |
|
8/7/2010 |
77 |
15 |
|
9/7/2010 |
86 |
15 |
|
10/7/2010 |
116 |
16 |
|
11/7/2010 |
113 |
17 |
|
12/7/2010 |
89 |
16 |
|
13/7/2010 |
98 |
17 |
|
14/7/2010 |
104 |
16 |
|
15/7/2010 |
128 |
16 |
|
16/7/2010 |
115 |
16 |
|
17/7/2010 |
91 |
15 |
|
18/7/2010 |
105 |
14 |
|
19/7/2010 |
51 |
14 |
|
20/7/2010 |
123 |
13 |
|
21/7/2010 |
105 |
13 |
|
22/7/2010 |
75 |
13 |
|
23/7/2010 |
93 |
13 |
|
24/7/2010 |
FGD bypassed |
16 |
|
25/7/2010 |
FGD bypassed |
15 |
|
26/7/2010 |
FGD bypassed |
18 |
|
27/7/2010 |
* |
* |
|
28/7/2010 |
* |
* |
|
29/7/2010 |
* |
* |
|
30/7/2010 |
* |
* |
|
31/7/2010 |
* |
* |
|
Date |
Daily Maximum |
|
|
SO2 concentration (mg/Nm3) # |
Opacity (%) |
|
|
1/8/2010 |
* |
* |
|
2/8/2010 |
FGD bypassed |
14 |
|
3/8/2010 |
FGD bypassed |
21 |
|
4/8/2010 |
FGD bypassed |
21 |
|
5/8/2010 |
* |
* |
|
6/8/2010 |
* |
* |
|
7/8/2010 |
* |
* |
|
8/8/2010 |
* |
* |
|
9/8/2010 |
* |
* |
|
10/8/2010 |
* |
* |
|
11/8/2010 |
* |
* |
|
12/8/2010 |
* |
* |
|
13/8/2010 |
* |
* |
|
14/8/2010 |
* |
* |
|
15/8/2010 |
77 |
14 |
|
16/8/2010 |
113 |
13 |
|
17/8/2010 |
76 |
16 |
|
18/8/2010 |
120 |
16 |
|
19/8/2010 |
91 |
17 |
|
20/8/2010 |
105 |
16 |
|
21/8/2010 |
104 |
18 |
|
22/8/2010 |
117 |
19 |
|
23/8/2010 |
134 |
21 |
|
24/8/2010 |
100 |
20 |
|
25/8/2010 |
89 |
24 |
|
26/8/2010 |
106 |
22 |
|
27/8/2010 |
135 |
16 |
|
28/8/2010 |
127 |
15 |
|
29/8/2010 |
135 |
16 |
|
30/8/2010 |
127 |
15 |
|
31/8/2010 |
98 |
14 |
|
Date |
Daily Maximum |
|
|
SO2 concentration (mg/Nm3)# |
Opacity (%) |
|
|
1/9/2010 |
89 |
16 |
|
2/9/2010 |
103 |
17 |
|
3/9/2010 |
106 |
15 |
|
4/9/2010 |
116 |
16 |
|
5/9/2010 |
102 |
15 |
|
6/9/2010 |
132 |
16 |
|
7/9/2010 |
143 |
14 |
|
8/9/2010 |
143 |
14 |
|
9/9/2010 |
101 |
16 |
|
10/9/2010 |
80 |
16 |
|
11/9/2010 |
67 |
21 |
|
12/9/2010 |
144 |
16 |
|
13/9/2010 |
124 |
15 |
|
14/9/2010 |
FGD bypassed |
14 |
|
15/9/2010 |
* |
* |
|
16/9/2010 |
FGD bypassed |
19 |
|
17/9/2010 |
FGD bypassed |
26 |
|
18/9/2010 |
FGD bypassed |
28 |
|
19/9/2010 |
FGD bypassed |
24 |
|
20/9/2010 |
FGD bypassed |
29 |
|
21/9/2010 |
* |
* |
|
22/9/2010 |
* |
* |
|
23/9/2010 |
* |
* |
|
24/9/2010 |
* |
* |
|
25/9/2010 |
* |
* |
|
26/9/2010 |
* |
* |
|
27/9/2010 |
FGD bypassed |
19 |
|
28/9/2010 |
FGD bypassed |
20 |
|
29/9/2010 |
FGD bypassed |
20 |
|
30/9/2010 |
FGD bypassed |
21 |
Note: # - Hourly average value. Expressed as at 0ºC, 101.325kPa, dry and corrected to 12% CO2 condition.
* - Unit L2 was not on load.
B.2.4 Summary of Annual Stack Particulate Sampling
|
Unit |
Date |
Results (mg/Nm3) |
|
L2 |
02/07/2010 |
9 |
Monitoring Equipment: Napp model 32 (Manual stack sampling system)
B.3 Ambient SO2 and NO2 monitoring Data at Southern District and Cheung Chau
Appendix C Summary Results on Water Quality Monitoring
|
LAMMA POWER STATION |
|||||||
|
FGD WASTEWATER TREATMENT PLANT |
|||||||
|
EFFLUENT DISCHARGE TO ASH LAGOON |
|||||||
|
SUSPENDED SOLIDS AND PH |
|||||||
|
|
|
|
|
|
|
|
|
|
|
|
|
|
|
|
|
|
|
Period : July - September 2010 |
|
|
|
|
|
||
|
|
|
|
|
|
|
|
|
|
Week Ending |
No. of Samples |
Suspended Solids, mg/L |
pH |
||||
|
Maximum |
Minimum |
Average |
Maximum |
Minimum |
Average |
||
|
03/07/10 |
6* |
17 |
13 |
15 |
7.9 |
7.8 |
7.9 |
|
10/07/10 |
6* |
17 |
14 |
16 |
7.9 |
7.8 |
7.8 |
|
17/07/10 |
7 |
16 |
12 |
14 |
8.0 |
7.9 |
7.9 |
|
24/07/10 |
6* |
19 |
12 |
15 |
8.0 |
7.8 |
7.9 |
|
31/07/10 |
7 |
18 |
13 |
15 |
8.0 |
7.9 |
8.0 |
|
07/08/10 |
5* |
20 |
12 |
16 |
8.1 |
7.9 |
8.0 |
|
14/08/10 |
6* |
19 |
14 |
16 |
8.3 |
8.2 |
8.2 |
|
21/08/10 |
5* |
18 |
14 |
16 |
8.2 |
8.0 |
8.2 |
|
28/08/10 |
7 |
19 |
12 |
16 |
8.2 |
8.0 |
8.1 |
|
04/09/10 |
7 |
19 |
13 |
16 |
8.2 |
8.0 |
8.1 |
|
11/09/10 |
7 |
19 |
13 |
16 |
8.3 |
8.1 |
8.2 |
|
18/09/10 |
7 |
18 |
13 |
15 |
8.4 |
8.2 |
8.3 |
|
25/09/10 |
7 |
20 |
12 |
17 |
8.3 |
8.2 |
8.3 |
|
Remark : |
|
* - No sampling for the remaining day(s) of the week / no sampling due to no discharge |
|
LAMMA POWER STATION |
|||||
|
FGD WASTEWATER TREATMENT PLANT |
|||||
|
EFFLUENT DISCHARGE TO ASH LAGOON |
|||||
|
TRACE METAL, TOTAL PHOSPHORUS |
|||||
|
AND TOTAL NITROGEN ANALYSIS |
|||||
|
|
|
|
|
|
|
|
|
|
|
|
|
|
|
Period : July - September 2010 |
|
|
|
|
|
|
|
|
|
|
|
|
|
Sampling date |
|
5/7/2010 |
3/8/2010 |
7/9/2010 |
|
|
Barium, |
ug/L |
<150 |
<150 |
<150 |
|
|
Mercury, |
ug/L |
<0.5 |
<0.5 |
0.8 |
|
|
Cadmium, |
ug/L |
3 |
1 |
2 |
|
|
Iron, |
ug/L |
<400 |
<400 |
<400 |
|
|
Total Phosphorous, |
mg/L |
<0.8 |
<0.8 |
<0.8 |
|
|
Total Nitrogen, |
mg/L |
90 |
107 |
193 |
|
|
Cyanide, |
mg/L |
0.03 |
0.02 |
0.03 |
|
|
|
|
|
|
|
|
|
Remark: |
|
|
|
|
|
|
|
|
|
|
|
|
|
According to the WPCO Ash Lagoon Discharge Licence, contents at exact |
|||||
|
levels of trace metals below 1/10 th of the WPCO Licence permitted limits |
|||||
|
will not be reported. When the concentration of a metal exceeds 1/10 th of |
|||||
|
the limit, the exact value of the metal concentration will be reported. |
|
||||
|
EM&A Log Ref. |
Mitigation Measures |
Implementation Status |
|
|
General |
|
|
A1 |
No other process, except the Wet Limestone-Gypsum process used in the FGD plants of the coal-fired Units L6, L7 and L8 within the Lamma Power Station, shall be used in the FGD plants for the projects unless otherwise agreed by EPD.
|
Complied |
|
|
|
|
|
|
Water Quality |
|
|
B1 |
All wastewater arising from the operation of the projects shall be collected and directed to the existing wastewater treatment plant within the Lamma Power Station for treatment.
|
Complied |
|
B2 |
The operational plant effluent from the FGD plants should be reused as much as possible in order to minimise discharge to the WWTP.
|
Complied |
|
B3 |
Maintenance of the WWTP should be performed regularly to ensure the effluent from the WWTP would not exceed the current requirements stipulated in the WPCO licence for Ash Lagoon.
|
Complied |
|
|
|
|
|
|
waste |
|
|
C1 |
No gypsum or sludge arising from the operation of the projects shall be disposed of anywhere. All gypsum and sludge shall be collected and reused.
|
Complied |
|
|
|
|
|
|
noise |
|
|
D1 |
Equipments including the Absorber Recirculation Pump, Oxidation Air Blower, Booster Fan and Booster Fan Motor of the FGD plants shall be acoustically insulated and the Gas-Gas Heater (untreated side) of the FGD plants shall be provided with reinforced lagging to reduce the noise impact.
|
Complied |
|
|
|
|