1.
Introduction
Baseline water quality monitoring was conducted in
accordance with the Environmental Monitoring and Audit (EM&A) Manual
(Construction Phase) for the Lamma Power Station Navigation Channel Improvement
(thereafter called the “Project”) pursuant to Clauses 4.1 and 4.2 of the
Environmental Permit (EP-165/2003).
1.1
Purpose of the Report
The purpose of this report is to establish baseline levels for impact monitoring of marine water quality during the construction phase of
the Project. This report presents the methodologies and results of
baseline marine water quality measurements.
1.2
Background
HEC proposes to improve the existing navigation channel
in order to provide safe shipping access for
coal ships to and from the Lamma Power Station. The Project involves restoring the depth of existing channel
by dredging to a water depth of –16 mPD approximately with an estimated total
dredging volume of 2.98 million m3.
The Channel was first dredged to –15.9 mPD
(approximately) in 1981.
Maintenance of the Channel by means of dredging down to about –16.5 mPD
level was carried out in 1989-1990.
To cope with the updated vessel operation, the turning basin of the
Channel was enlarged by extending 250m southward in early 2001.
The Environmental Impact Assessment (EIA) Report for the
Project, which was prepared in response to EIA Study Brief (ESB-078/2001)
issued to The Hongkong Electric Company Limited (HEC) by the Environmental
Protection Department (EPD), was completed in January 2003. The EIA Report was submitted to the
Director of Environmental Protection Protection (DEP) in accordance with the
requirements of the Environmental Impact Assessment Ordinance (EIAO) and was
approved by DEP on 11 March 2003.
The Environmental Permit (EP-165/2003) was issued to HEC on 8 April
2003.
The Project Area is illustrated in Figure
1.1. The shaded area shows the
limit of the Channel where dredging will be required under this Project. According to the latest bathymetric
survey of the Channel, there is already sufficient water depth in the remaining
section of the Channel in the south (beyond the shaded area in Figure
1.1) and no dredging will be required.
The dredging options for the Project are:
(1) continuous dredging using grab dredgers with
cage-type silt curtains or
(2) intermittent dredging using one Trailer
Suction Hopper Dredger (TSHD).
Only one of the two dredging
options will be deployed. The
dredging work is tentatively scheduled to take place from May to December
2003. Dredged sediments will be
transported to the
disposal sites approved by the Marine Fill Committee for disposal.
1.3
Structure of the Baseline Monitoring Report
The structure of the report is as follows:
Section 1: Introduction – detailing the purpose and structure of the report
Section
2: Water
Quality – presenting the results of baseline marine water
quality monitoring
Section 3: Conclusion
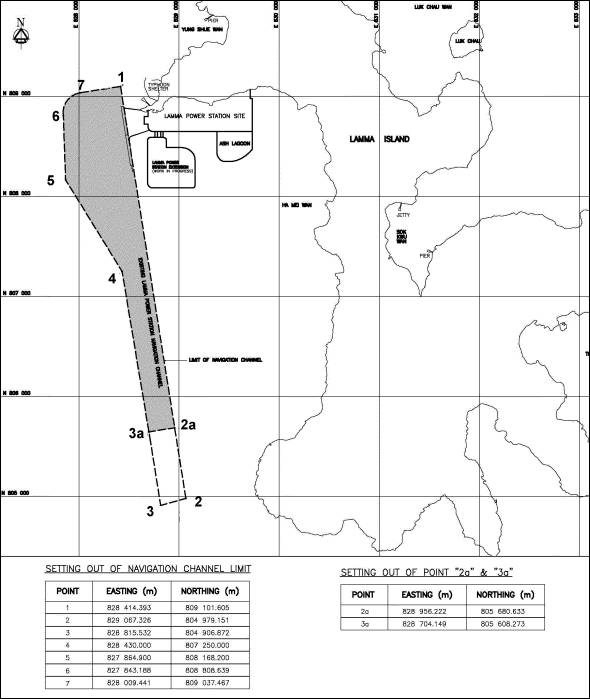
Figure 1.1 Layout
of Work Site
2.
Water Quality
2.1
Monitoring Locations
In order to monitor
the potential environmental impact of the project during the construction
period, seven stations (SR6, SR7, SR10, SR11, SR12, SR14 and SR15) were
selected as the sensitive receiver monitoring locations to gauge any potential
impact on water quality during the entire construction period. Moreover, another three control
monitoring stations (CS1, CS2 and CS3), which were not predicted to be impacted
by the dredging works related to the project, were also monitored together with
the sensitive receiver monitoring stations so as to reveal the possible background fluctuation of the study area
during the impact monitoring period.
These locations are listed in Table 2.1 below, and
are also depicted in Figure
2.1.
Table
2.1 Marine Water
Monitoring Locations
|
Type
|
Monitoring Location
|
HK Metric Grid E
|
HK Metric Grid N
|
|
Sensitive Receiver Stations
|
SR6
|
830 150
|
811 500
|
|
SR7
|
829 004
|
810 903
|
|
SR10
|
829 194
|
808 600
|
|
SR11
|
830 119
|
808 650
|
|
SR12
|
830 386
|
807 189
|
|
SR14
|
829 977
|
805 758
|
|
SR15
|
829 566
|
804 545
|
|
Marine Control Stations
|
CS1
|
828 000
|
813 492
|
|
CS2
|
825 000
|
808 000
|
|
CS3
|
829 000
|
802 000
|
2.2
Monitoring Periods
The monitoring began
on 31 March 2003 and continued until 26 April 2003. During the period, baseline marine water quality monitoring
data was collected three times per week for four weeks at each monitoring
station during mid-ebb and mid-flood tides. The baseline monitoring periods for marine water are
summarized in Table
2.2.
The monitoring schedule has been submitted to EPD on 19 March 2003.
Table 2.2 Baseline
Monitoring Periods
|
Sampling Dates
|
Sampling Time
|
Tide Conditions
|
Weather
|
|
31/3/2003 (Mon)
|
11:10 - 13:52
16:19 - 18:43
|
Ebb
Flood
|
Overcast
Overcast
|
|
2/4/2003 (Wed)
|
12:00 – 14:56
16:05 – 18:35
|
Ebb
Flood
|
Overcast
Overcast
|
|
4/4/2003 (Fri)
|
09:00 – 10:50
13:00 – 15:40
|
Flood
Ebb
|
Rainy
Rainy
|
|
7/4/2003 (Mon)
|
08:55 – 10:54
14:05 – 16:01
|
Flood
Ebb
|
Overcast
Overcast
|
|
9/4/2003 (Wed)
|
08:55 – 11:14
16:05 – 18:15
|
Flood
Ebb
|
Overcast
Overcast
|
|
11/4/2003 (Fri)
|
10:05 – 12:08
16:15 – 18:36
|
Flood
Ebb
|
Overcast
Overcast
|
|
14/4/2003 (Mon)
|
10:00 – 12:15
15:29 – 17:12
|
Ebb
Flood
|
Overcast
Overcast
|
|
16/4/2003 (Wed)
|
10:50 – 12:55
15:30 – 17:49
|
Ebb
Flood
|
Overcast
Overcast
|
|
18/4/2003 (Fri)
|
08:25 – 10:15
12:30 – 14:55
|
Flood
Ebb
|
Sunny
Sunny
|
|
22/4/2003 (Tue)
|
10:30 – 12:16
15:45 – 17:38
|
Flood
Ebb
|
Overcast
Sunny
|
|
24/4/2003 (Thu)
|
09:55 – 11:50
16:00 – 17:55
|
Flood
Ebb
|
Sunny
Sunny
|
|
26/4/2003 (Sat)
|
09:17 – 11:23
13:59 – 16:01
|
Ebb
Flood
|
Overcast
Overcast
|
2.3
Monitoring Equipment
Table 2.3 summarizes the equipment used in the baseline water quality monitoring
programme.
Table 2.3 Water Quality Monitoring Equipment
|
Equipment
|
Detection Limit
|
|
YSI 6920 Water Quality Monitor
|
Temperature: -5 to 45 0C; +/-
0.15 0C
Salinity: 0 to 70 ppt; +/- 0.1 ppt
Dissolved Oxygen: 0 to 200%; +/- 0.2%
0 to 20 mg/L; +/- 0.2 mg/L
Turbidity: 0 to 1000 NTU; +/- 5% of the
range
pH: 0 to 14
units; +/- 0.2 units
|
|
Trimble NT300D GPS
|
Accuracy better than 3m
|
|
Eagle Fisheasy ST Portable Depth Finder
|
Accuracy better than 0.5m
|
2.4
Monitoring
Parameters, Frequency and Duration
Table 2.4
summarizes the monitoring parameters and frequencies of baseline water quality
monitoring.
Table 2.4 Water
Quality Monitoring Parameters and Frequency
|
Monitoring Stations
|
Parameters
|
Frequency
|
No. of Depths
|
No. of Samples
|
|
Sensitive
Receiver Stations
SR6,
SR7, SR10, SR11, SR12, SR14 & SR15
Marine Control Stations
CS1, CS2, CS3
|
·
Depth, m
·
Temperature, oC
·
Salinity, ppt
·
DO, mg/L
·
DO Saturation, %
·
Turbidity, NTU
·
SS, mg/L
·
pH
|
|
3
Surface,
Mid-Depth
and Bottom
|
2
Mid-ebb
and Mid-flood
|
2.5
Monitoring
Methodology and Calibration Details
Monitoring Methodology
·
The monitoring stations were accessed using survey boat
to within 3m, guided by Differential Global Positioning System (DGPS).
·
The water depth of the monitoring location at sampling
time was measured using depth meter.
Afterwards, the probes of the in-situ measurement equipment were lowered
to the predetermined depths and the measurements taken accordingly.
·
A water sampler was lowered into the water to the
required sampling depths. Upon
reaching the pre-determined depth, a messenger to activate the sampler was
released which travel down the wire. The water sample was sealed within the
sampler before retrieving.
·
All measurements were taken at 3 water depths, where
appropriate, namely 1m below water surface, mid-depth, and 1 meter from seabed,
except where the water depth was less than 6m, whereupon the mid-depth
measurement was omitted. If the
water depth was less than 3m, only the mid-depth position was monitored.
·
One duplicate in-situ measurement and water sample for
laboratory analyses were taken at all sampling locations.
·
At each measurement depth, two consecutive measurements
were be taken. The probe was
retrieved out of the water after the first measurement and then redeployed for
the second measurement. When the
difference in value between the first and second measurement of on-site
parameters was more than 25% of the value of the first reading, the reading was
discarded and further readings were taken.
·
A water sampler, consisting of a transparent PVC or glass
cylinder of not less than two litres which could be effectively sealed with
cups at both ends, was used. The
water sampler had a positive latching system to keep it open and prevent
premature closure until released by a messenger when the sampler was at the
selected water depth.
·
Water samples for SS measurements were transferred
directly to high density polythene sample bottles, packed in ice (cooled to 4oC
without being frozen), and delivered to a HOKLAS laboratory as soon as possible
after collection.
·
In addition, field information such as the general
meteorological conditions and observations regarding any significant activities
in the vicinity of each monitoring location were also recorded.
Equipment Calibration
The equipment deployed for in-situ
measurement of marine water quality was calibrated before use. The methodologies for the calibration
follow the instruction manuals provided by the corresponding manufacturers. The calibration records are shown in Appendix A.
Laboratory Analysis
& QA/QC
The collected
marine water samples were analyzed for Suspended Solids with methodologies
shown in Table
2.5.
Table 2.5 Laboratory
Analysis Methodologies of Marine Water Samples
|
Parameter
|
Method
|
Limit of Reporting
(mg/L)
|
|
Suspended
Solids
|
APHA
17 ed 2540 D
|
1.0
|
In order to
ensure that the laboratory analysis works were carried out properly, stringent
QA/QC procedures (which include sample preparation as well as subsequent instrumentation
analysis) were followed. According
to the requirements stipulated in the EM&A Manual, QA/QC requirements for
laboratory testing include:
1)
"Blind" duplicate samples analysis of 10% collected
marine water samples; and
2)
in-house QA/QC procedures of the testing laboratory (this
includes the use of blank, batch duplicates and quality control samples).
Blind
Duplicate:
In order to
cross check the accuracy of the measurement results by the laboratory analysis,
“blind” duplicate samples of 10% of the collected marine water samples were
analyzed alongside the normal samples.
The sample codes for the “blind” duplicates were determined by the
sampling team and are not identifiable by the laboratory. The results of the “blind” duplicate
samples are summarized in Appendix B.
Blank:
A laboratory
blank is an analyte free matrix to which all reagents are added in the same
volumes or proportions as used in the standard sample preparation to monitor
contamination introduced in laboratory.
All the laboratory blank values and acceptance criterion of suspended
solids are summarized in Appendix B.
Batch
Duplicate:
Batch duplicate
is an intra-laboratory split sample randomly selected from the sample batch to
monitor the method precision in a given matrix. The acceptance limit of duplicate values of suspended solids
and their duplicate results are summarized in Appendix B.
Quality
Control Sample:
The quality
control sample is the analysis of a material with a known concentration of
contaminants to determine the accuracy of results in a given matrix. The results of quality
control samples for suspended solids are shown in Appendix B.
A total of (1440) sets of samples for Suspended Solids
analysis were received during the marine monitoring period including
both ebb and flood tides. At least
5% laboratory blanks, batch duplicates and quality control samples for
Suspended Solids were used. The
acceptance criteria are outlined in Quality Control data.
The QA/QC
results in Appendix
B indicated that the laboratory analysis
works of the collected marine water samples were properly carried out and the
measurement results obtained were valid in accordance with the Hong Kong
Laboratory Accreditation Scheme (HOKLAS) requirements. Moreover, the “blind” duplicate
measurement results indicated that the precision of the measurements for
Suspended Solids complied with HOKLAS requirements.
2.6
Baseline Monitoring Results
The on-site
measurement and laboratory analysis results of marine water at all monitoring
locations are detailed in Appendix C.
The averages
and ranges of the monitoring parameters of the baseline data at each monitoring
location are summarized in Appendix D. The results of Dissolved Oxygen,
Turbidity and Suspended Solids are presented graphically in Appendix E.
Based on the
observation made by the sampling team during the course of baseline monitoring,
the weather conditions during the monitoring period at all monitoring locations
were suitable for baseline monitoring.
On-site
observation was carried out by the sampling team at each monitoring location
during each sampling trip. The
sampling team did not observe any pertinent activities at the vicinity of the
study area that would affect the baseline monitoring results. There was no abnormal operation at the
Lamma Power Station during the period of the baseline marine water
monitoring. Further, no abnormal
construction activities at the construction of Lamma Power Station Extension
project was recorded. Based on the
above, it is considered that the conditions of the study area during the
monitoring periods were appropriate for baseline monitoring.
2.7
Action and Limit Levels
Exceedance of Action Level during the impact monitoring
period would indicate that environmental quality is deteriorating. Exceedance of Limit Level during the
impact monitoring period would indicate that environmental quality has become
unacceptable. An Event Action Plan
for responding to these exceedances is documented in the EM&A Manual.
Action and Limit Levels for marine water quality were
established from baseline levels in accordance with the EM&A Manual. In order to take into account the
seasonal variations of the baseline DO level, separate baseline DO levels in
dry seasons (November to March) and wet seasons (April to October) were derived
both from the baseline data obtained prior to the commencement of works and
EPD’s routine monitoring data in the study area over the last 5 years.
One way Analysis of Variance (ANOVA) was applied to test
for the differences in the baseline monitoring data of Dissolved Oxygen among
the sensitive receiver stations (SR6, SR7, SR10, SR11, SR12, SR14 and
SR15). The analysis results
(P-values) of DO (Surface & Middle) and DO (Bottom) were 0.989 and 0.974
respectively. This showed that no significant difference in Dissolved Oxygen
was found among the seven sensitive receiver stations.
The baseline monitoring work for DO was conducted in
April 2003 which was just the onset of the wet season. Also, according to the Hong Kong
Observatory, April 2003 was drier than normal as the monthly rainfall was only
84.5 millimetres, about half the normal figure of 161.5 millimetres. Hence, if all the baseline DO figures
were placed into the data pool of wet season figures, the true picture of DO
levels in the wet season would be skewed.
Therefore, it was considered more appropriate to pool the DO baseline
monitoring data with EPD’s routine monitoring data in dry seasons instead of
wet seasons.
EPD monitoring data measured at the same water control
zones in which the sensitive receivers are located was applied to the
monitoring stations. For SR6, the
Action and Limit levels were calculated from Marine Water Quality (MWQ) results
at WM1 while that for SR7-SR15, data at SM5-7 was used.
Based on the above approach, the Action Levels of SR6
and SR7-15 were calculated from the 5th percentile of MWQ results at WM1 and
SM5-7 respectively (and baseline results for dry season). Similarly, the Limit Levels of SR6 and
SR7-15 were calculated from the 1st percentile of MWQ results at WM1 and SM5-7
respectively (and baseline results for dry season) or the WQO for DO in
non-FCZ.
The MWQ results for DO at WM1 and SM5-7 over the last 5
years (viz. from 1997 to 2001) collected from EPD’s Website only are analyzed
and summarized in Table 2.6 and Table 2.7.
Table 2.6 EPD’s
MWQ Results for Dissolved Oxygen (Surface & Middle) from
1997 to 2001
|
Dissolved Oxygen
(Surface &
Middle)
|
WM1
|
SM5-7
|
|
Dry Seasons
|
|
Average
|
6.9
|
6.8
|
|
Minimum
|
3.7
|
4.5
|
|
Maximum
|
8.4
|
8.6
|
|
5 %-ile
|
5.3
|
4.8
|
|
1 %-ile
|
4.1
|
4.5
|
|
Wet Seasons
|
|
Average
|
5.7
|
6.5
|
|
Minimum
|
3.7
|
4.2
|
|
Maximum
|
8.7
|
10.8
|
|
5 %-ile
|
4.2
|
4.6
|
|
1 %-ile
|
3.9
|
4.3
|
Table 2.7 EPD’s
MWQ Results for Dissolved Oxygen (Bottom) from 1997 to
2001
|
Dissolved Oxygen
(Bottom)
|
WM1
|
SM5-7
|
|
Dry Seasons
|
|
Average
|
6.9
|
7.0
|
|
Minimum
|
3.2
|
4.8
|
|
Maximum
|
8.7
|
8.9
|
|
5 %-ile
|
5.6
|
5.0
|
|
1 %-ile
|
3.8
|
4.8
|
|
Wet Seasons
|
|
Average
|
4.8
|
5.4
|
|
Minimum
|
2.2
|
2.0
|
|
Maximum
|
7.4
|
9.3
|
|
5 %-ile
|
2.7
|
3.5
|
|
1 %-ile
|
2.3
|
2.0
|
Subsequent impact monitoring results will be compared
against the Action and Limit Levels.
Table 2.8 summarizes the methods of determining the
Action Levels and Limit Levels for various parameters.
Table
2.8 Methods of Determining
Action and Limit Levels for Water Quality
|
Parameters
|
Action
|
Limit
|
|
DO in mg/ L
(Surface, Middle
and Bottom).
|
Surface and
Middle
5%-ile of baseline and last 5 years’ MWQ in Hong Kong for surface and middle
layers.
|
Surface and
Middle
4 mg/L or 1%-ile
of baseline and last 5 years’ MWQ in Hong Kong for surface and
middle layers.
|
|
|
Bottom
5%-ile of baseline and last 5 years’ MWQ in Hong Kong for bottom layer.
|
Bottom
2 mg/L or 1%-ile
of baseline and last 5 years’ MWQ in Hong Kong for bottom
layer.
|
|
SS in mg/L
(depth-averaged)
|
95%-ile of
baseline data or 120% upstream control station's SS at the same tide of the
same day
|
99%-ile of
baseline, or 130% of upstream control station's SS at the same tide of the
same day. For SR10, the SS limit is 100 mg/L
|
|
Turbidity (Tby)
in NTU
(depth-averaged)
|
95%-ile of
baseline data or 120% of upstream control station’s Tby at the same tide on
the same day
|
99%-ile of
baseline data or 130% of upstream control station’s Turbidity at the same
tide on the same day
|
|
Notes:
·
“Depth-averaged” is calculated by taking the arithmetic mean of the reading of all three depths;
·
In order to take into account the seasonal variations of the baseline
DO level, separate baseline DO levels for the dry and the wet seasons would be derived both from the baseline data obtained prior to the
commencement of works and EPD’s routine monitoring data in the study area
over the last 5 years.
|
|
·
For DO, non-compliance of the water quality limits occurs when
monitoring result is lower than the limits.
·
For SS and Turbidity, non-compliance of the water quality limits
occurs when monitoring result is higher than the limits.
·
All the figures given in the table subject to revision pending
results of the baseline monitoring and subsequent approval by EPD.
·
Whichever of the two criteria is greater,
except DO which will take the lower of the two criteria, shall be used
as the Action and Limit levels. Subject to approval from EPD.
|
With the above methodology, the Actions and Limit Levels
have been calculated in compliance with the EM&A Manual and are shown in Table 2.9, Table 2.10 and Table
2.11. Calculations of 5%-ile
and 1%-ile of DO in wet and dry seasons are provided in Appendix F.
Table 2.9 Action
/ Limit Levels for Dissolved Oxygen (mg/L)
|
(a) Surface and Middle – Dry Season (November – March)
|
|
|
SR6
|
SR7
|
SR11
|
SR12
|
SR14
|
SR15
|
|
Action Level (5%-ile)
|
5.2*
|
5.2*
|
|
1%-ile
|
4.3**
|
4.6**
|
|
Limit Level
|
4.0***
|
|
Note:
|
|
|
1.
* - figure 5.2 mg/L
represents 5%-ile of baseline monitoring data and Marine Water Quality (MWQ)
in Hong Kong from 1997 to 2001
|
|
2.
** - figures 4.3
and 4.6 mg/L represent 1%-ile of baseline monitoring data and MWQ in Hong
Kong from 1997 to 2001
|
|
3.
*** - WQO for DO in non-FCZ
|
|
4. All
the figures may be subjected to review by EPD as and when necessary.
|
|
|
|
|
|
|
|
|
|
(b) Surface and Middle – Wet Season (April –
October)
|
|
|
SR6
|
SR7
|
SR11
|
SR12
|
SR14
|
SR15
|
|
Action Level (5%-ile)
|
4.2*
|
4.6*
|
|
1%-ile
|
3.9**
|
4.3**
|
|
Limit Level
|
4.0***
|
|
Note:
|
|
1.
* - figures 4.2
and 4.6 mg/L represent 5%-ile MWQ in Hong Kong from 1997 to 2001
|
|
2.
** - figures 3.9 and
4.3 mg/L represent 1%-ile of MWQ in Hong Kong from 1997 to 2001
|
|
3.
*** - the WQO for DO in non-FCZ
|
|
4. All
the figures may be subjected to review by EPD as and when necessary.
|
|
|
|
|
|
|
|
|
|
(c) Bottom – Dry Season (November – March)
|
|
|
SR6
|
SR7
|
SR11
|
SR12
|
SR14
|
SR15
|
|
Action Level (5%-ile)
|
5.5*
|
5.4*
|
|
1%-ile
|
4.1**
|
4.8**
|
|
Limit Level
|
2.0***
|
|
Note:
|
|
|
|
|
|
|
|
1.
* - figures 5.5 and
5.4 mg/L represent 5%-ile of baseline monitoring data and MWQ in Hong Kong
from 1997 to 2001
|
|
2.
** - figures 4.1
and 4.8 mg/L represent 1%-ile of baseline monitoring data and MWQ in Hong
Kong from 1997 to 2001
|
|
3.
*** - WQO for DO in non-FCZ
|
|
4.
All the figures may be subjected to review by EPD
as and when necessary.
|
|
|
(d) Bottom –
Wet Season (April –
October)
|
|
|
SR6
|
SR7
|
SR11
|
SR12
|
SR14
|
SR15
|
|
Action Level (5%-ile)
|
2.7*
|
3.5*
|
|
1%-ile
|
2.3**
|
2.0**
|
|
Limit Level
|
2.0***
|
|
Note:
|
|
|
|
|
|
|
|
1.
* - figures 2.7
and 3.5 mg/L represent 5%-ile of MWQ in Hong Kong from 1997 to 2001
|
|
2.
** - figures 2.3 and
2.0 mg/L represent 1%-ile of MWQ in Hong Kong from 1997 to 2001
|
|
3.
*** - WQO for DO in non-FCZ
|
|
4.
All the figures may be subjected to review by EPD
as and when necessary.
|
Table 2.10 Action / Limit Levels for Turbidity (NTU)
|
(depth-average)
|
|
|
|
|
|
|
|
|
SR6
|
SR7
|
SR11
|
SR12
|
SR14
|
SR15
|
|
Action Level (95%-ile)
|
16.4
|
15.3
|
13.5
|
14.2
|
16.1
|
16.1
|
|
Limit Level (99%-ile)
|
17.4
|
16.1
|
16.2
|
16.2
|
16.5
|
16.8
|
|
Note:
|
|
|
|
|
|
|
|
1.
95% ile of baseline data is adopted for setting the Action
Level for various SRs according to the EM&A Manual.
|
|
2.
99% ile of baseline data is adopted for setting the Limit
Level for various SRs according to the EM&A Manual.
|
|
3.
All the figures may be subjected to review by EPD
as and when necessary.
|
Table 2.11 Action
/ Limit Levels for Suspended Solids (mg/L)
|
(depth-average)
|
|
|
|
|
|
|
|
|
|
SR6
|
SR7
|
SR10
|
SR11
|
SR12
|
SR14
|
SR15
|
|
95%-ile
|
16.8
|
16.4
|
16.0
|
16.1
|
16.8
|
17.9
|
16.7
|
|
Action Level
|
16.8
|
16.4
|
--
|
16.1
|
16.8
|
17.9
|
16.7
|
|
99%-ile
|
16.9
|
16.8
|
16.2
|
16.4
|
17.0
|
18.8
|
17.8
|
|
Limit Level
|
16.9
|
16.8
|
100
|
16.4
|
17.0
|
18.8
|
17.8
|
|
Note:
|
|
|
1.
No Action Level is applied to SR10 according to the
EM&A Manual
|
|
2.
Limit Level of SR10 is 100 mg/L according to the
EM&A Manual
|
|
3.
95% ile of baseline data is adopted for setting the
Action Level for various SRs according to the EM&A Manual.
|
|
4.
99% ile of baseline data is adopted for setting the
Limit Level for various SRs according to the EM&A Manual.
|
|
5.
All the figures may be subjected to review by EPD
as and when necessary.
|
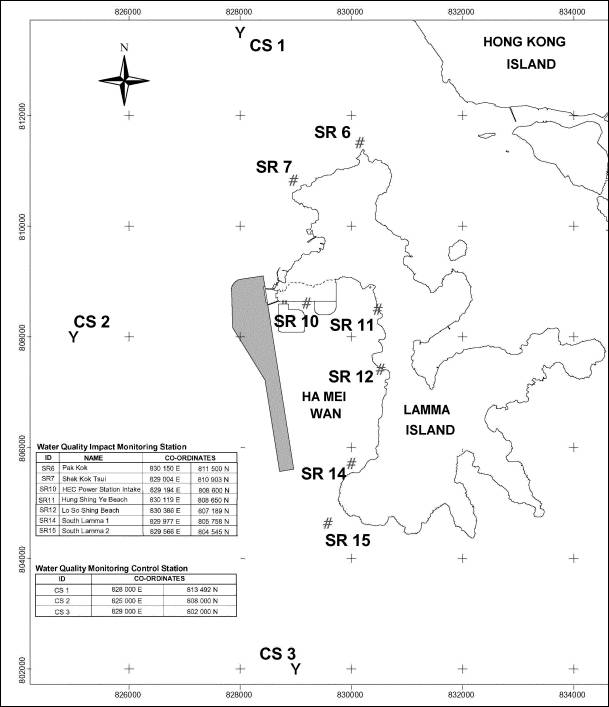
Figure
2.1 Locations
of Water Quality Monitoring Stations
3.
Conclusion
Marine water
quality baseline monitoring for the Project in March and April 2003 has been
completed. From an analysis of the
collected data and field observations, it can be concluded that the measured marine
quality are representative of pre-construction ambient conditions.
No
major activity influencing water quality was identified while carrying out baseline monitoring.
 The Hongkong Electric
Co. Ltd.
The Hongkong Electric
Co. Ltd.